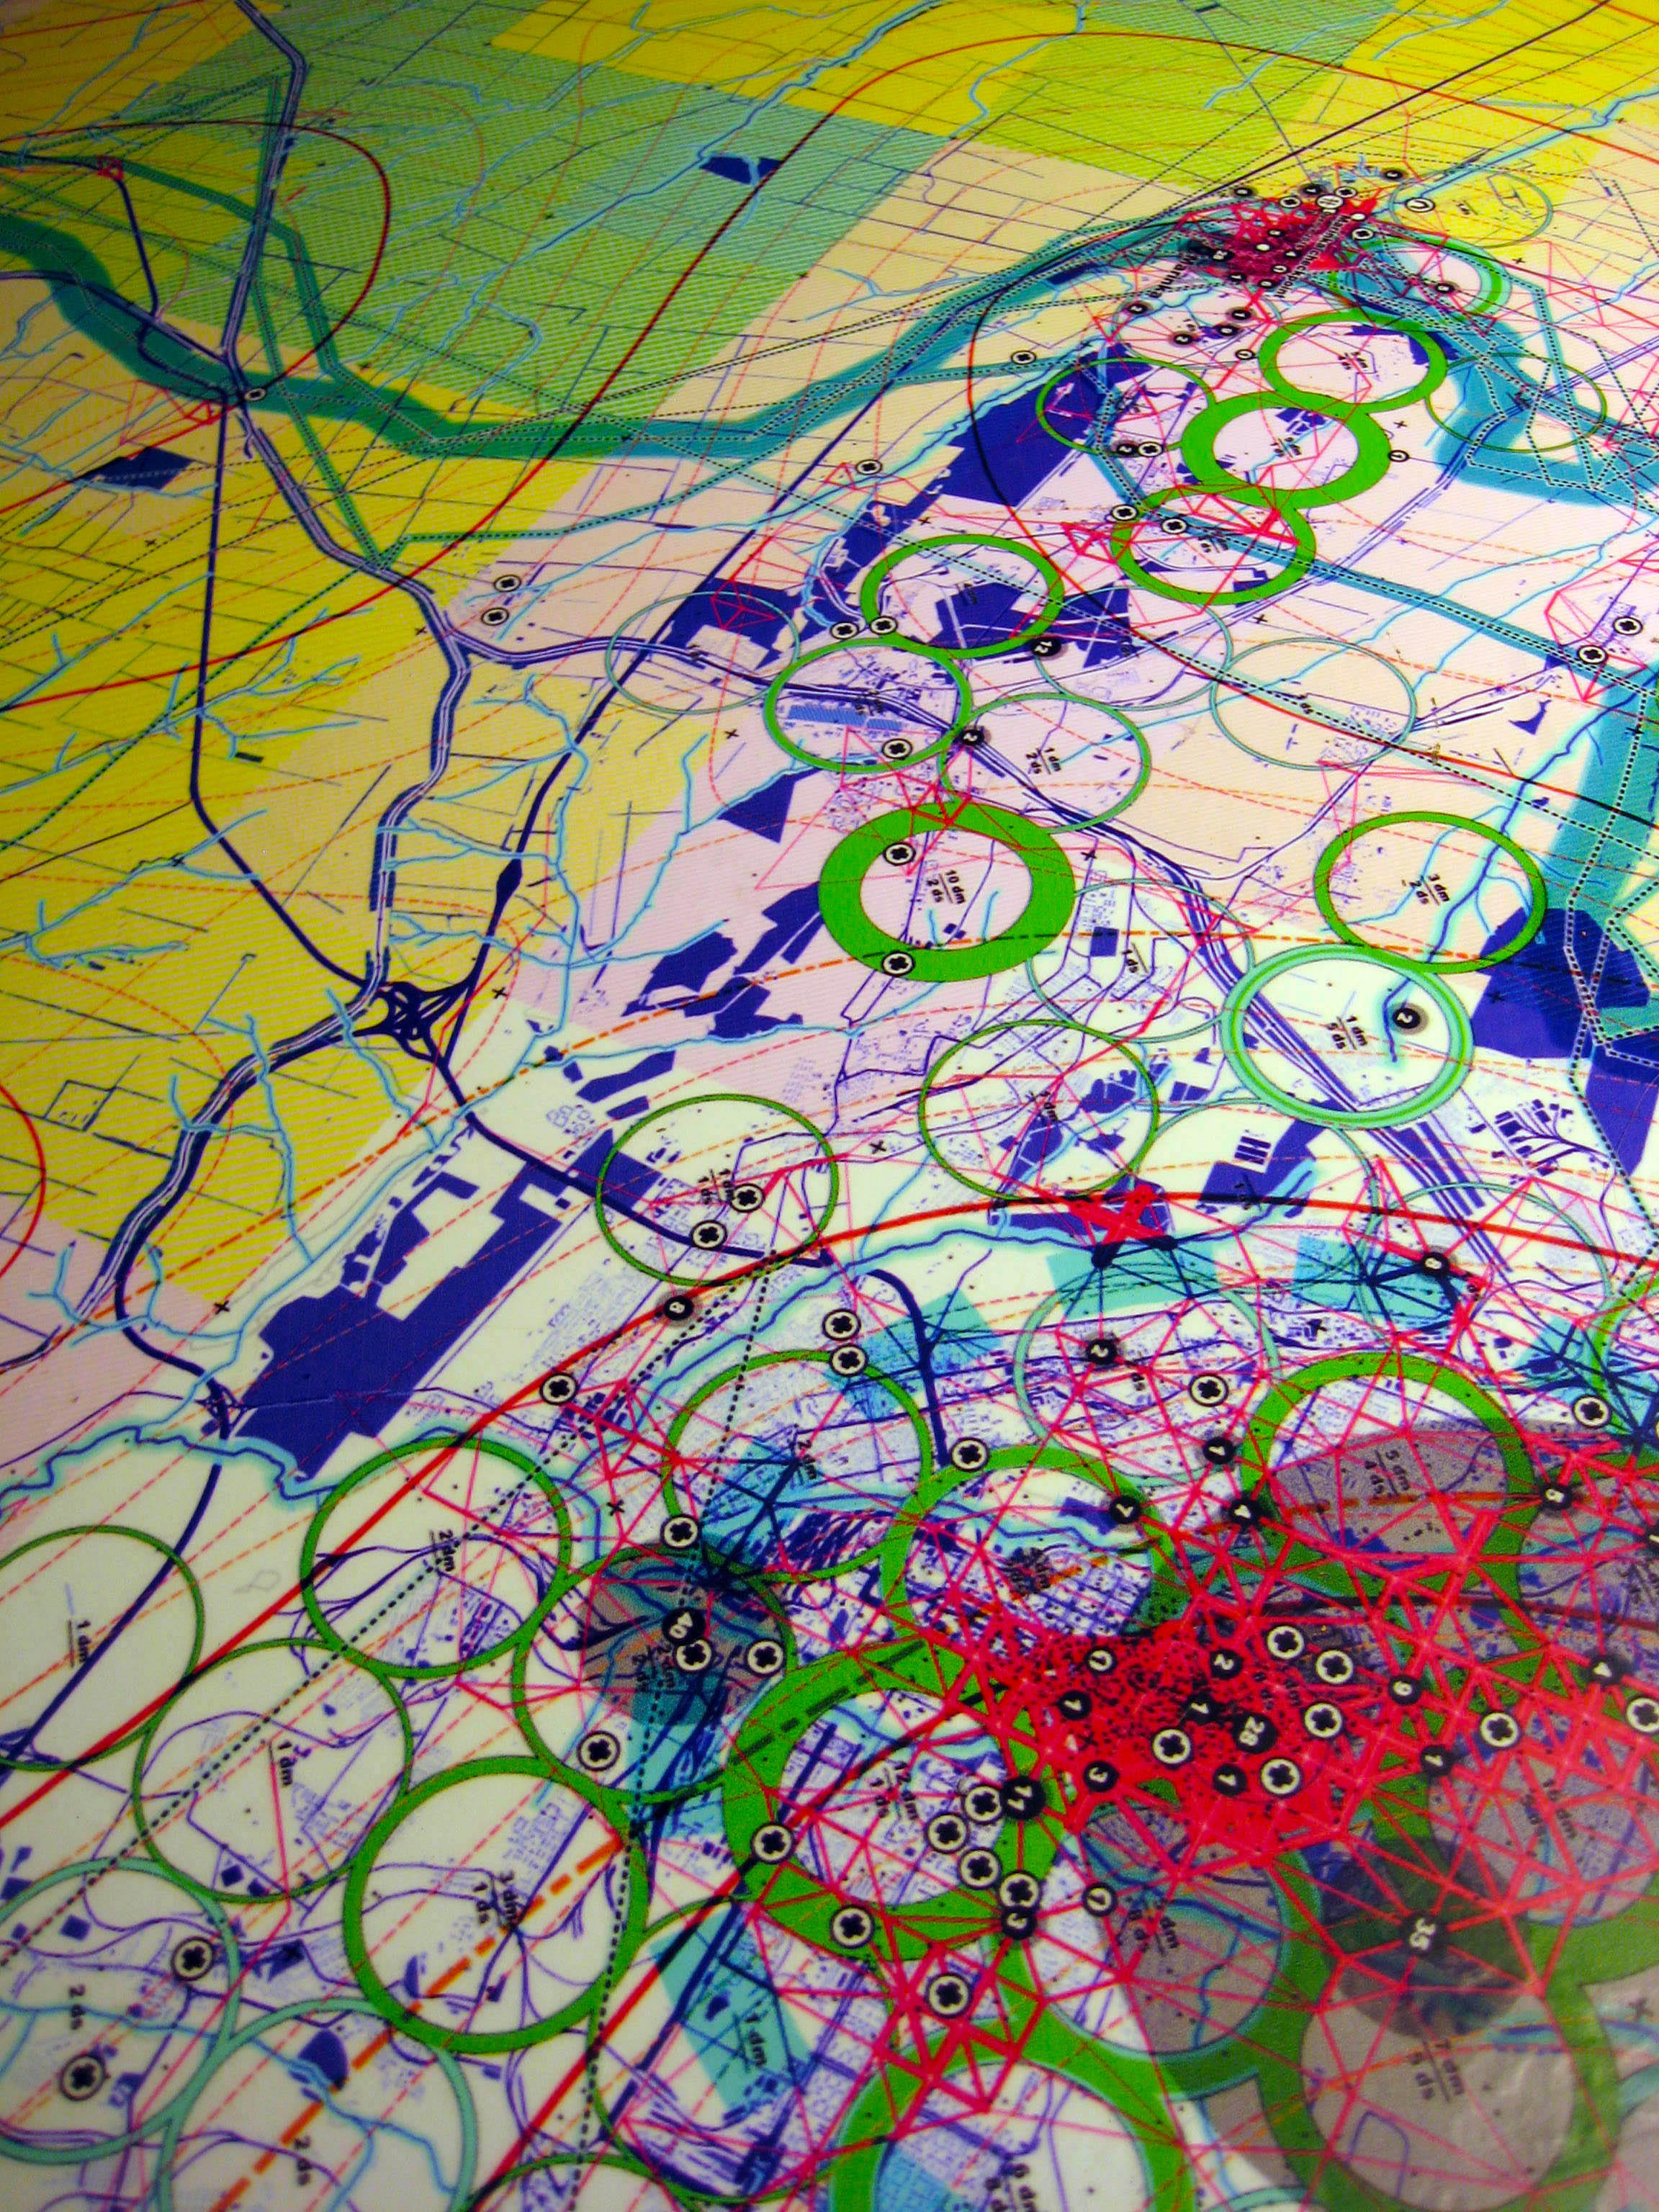
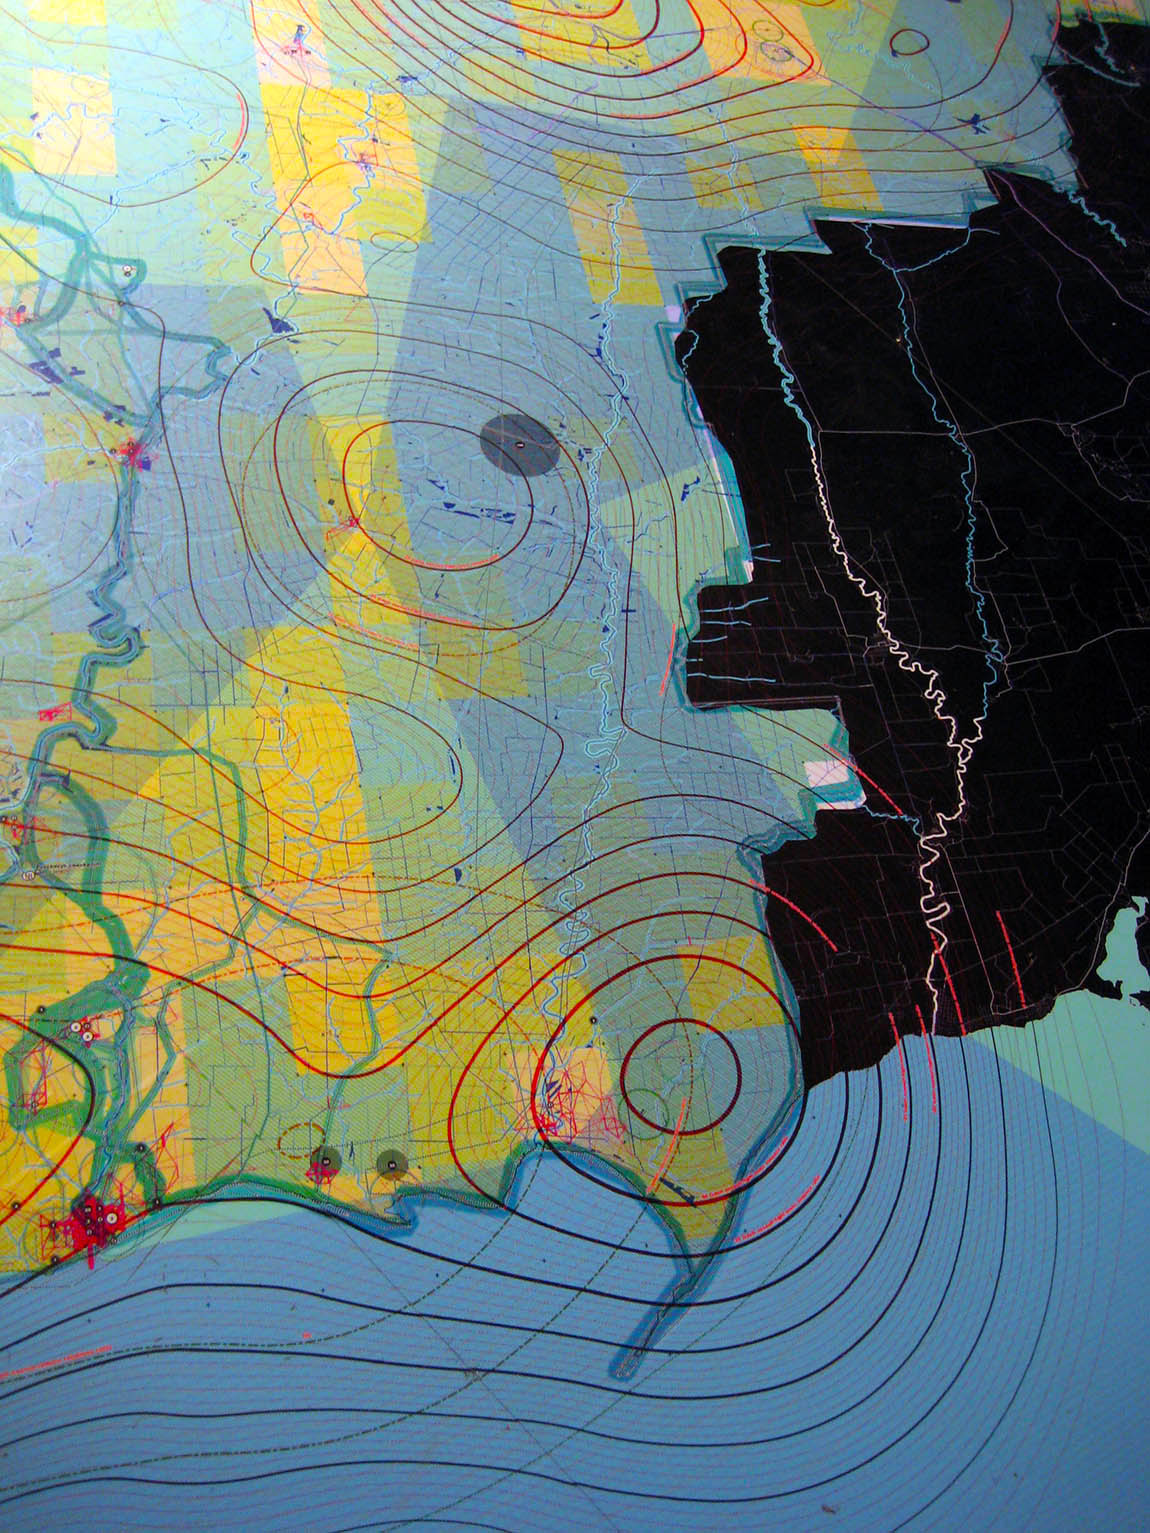
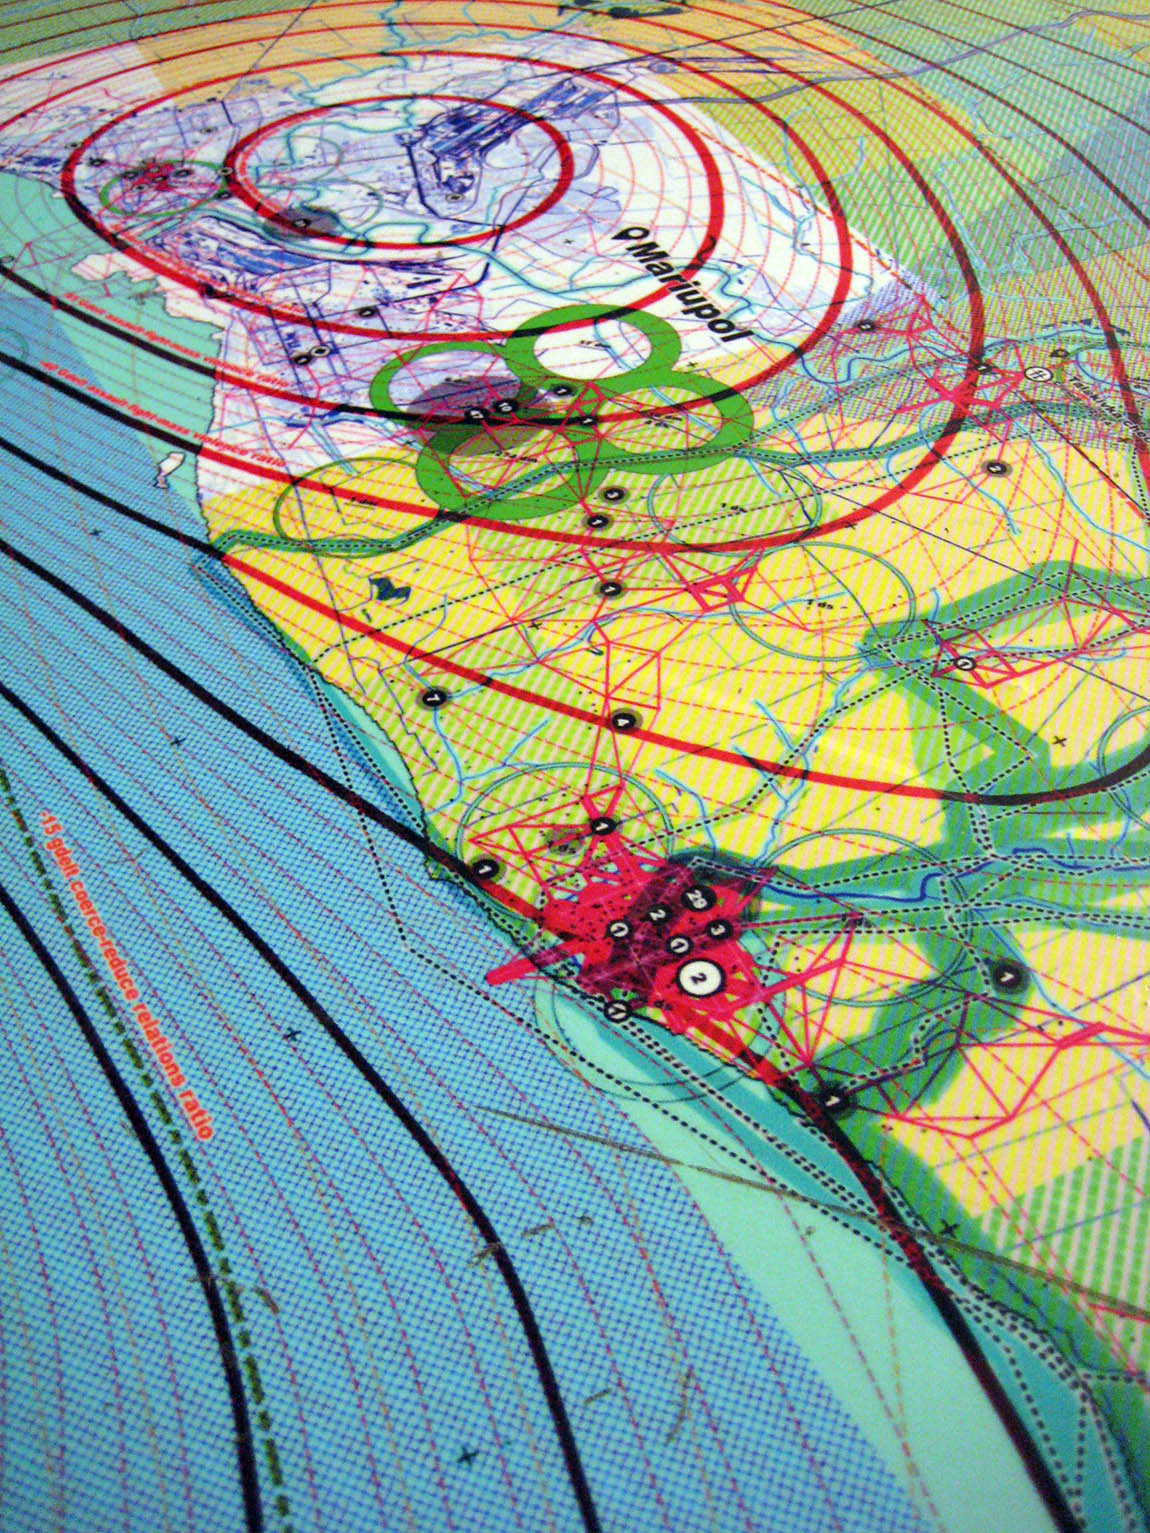
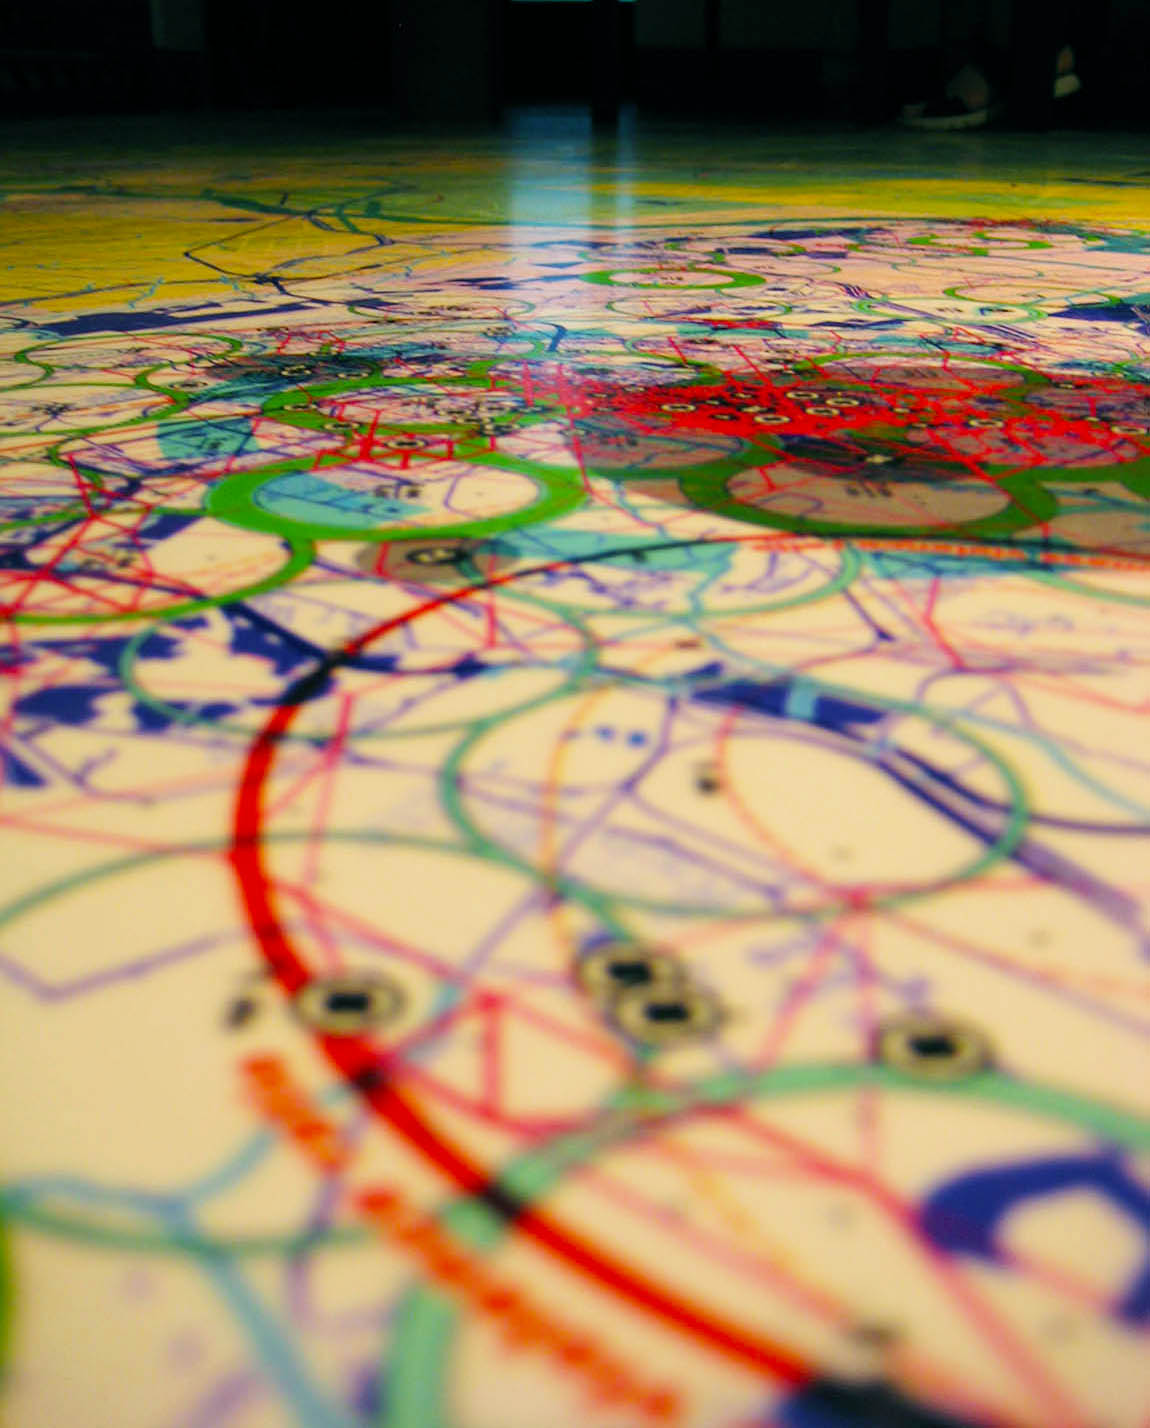
dataWar
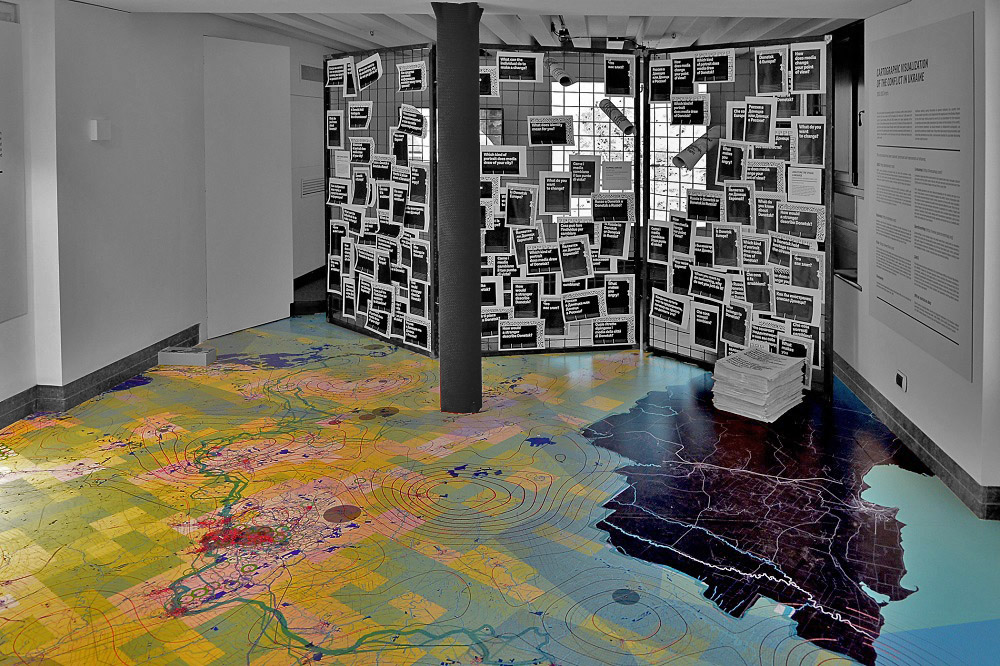
big data in times of war
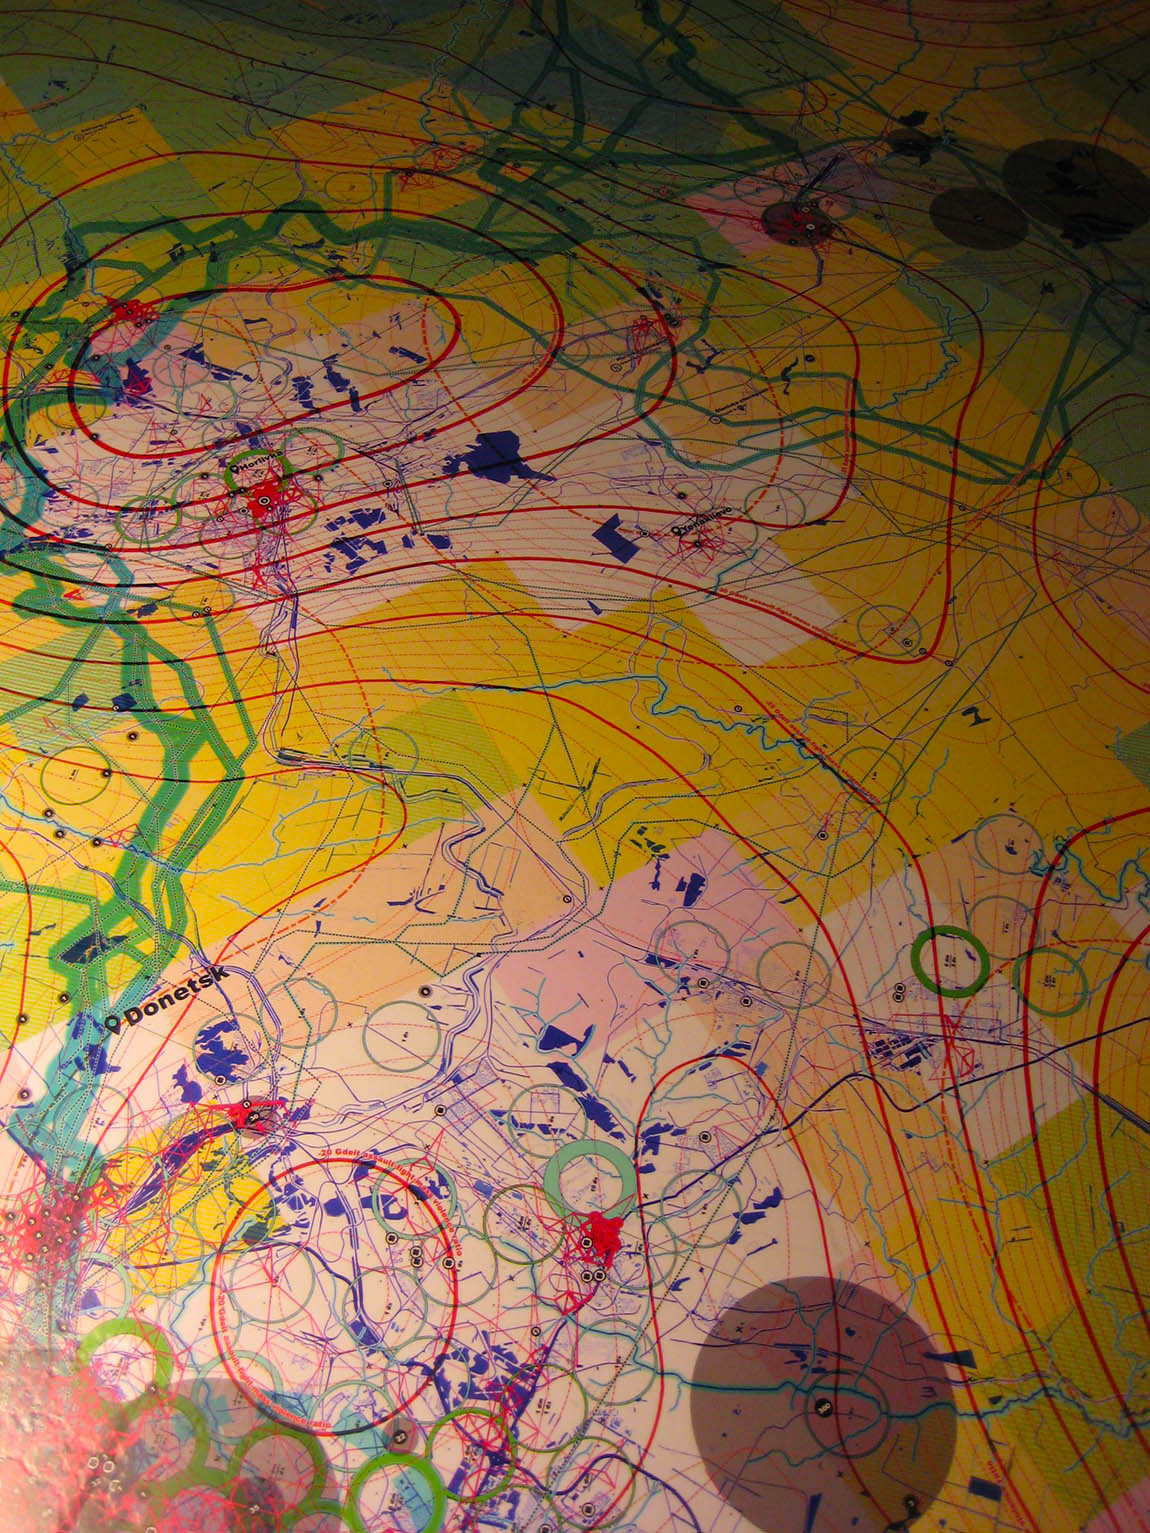
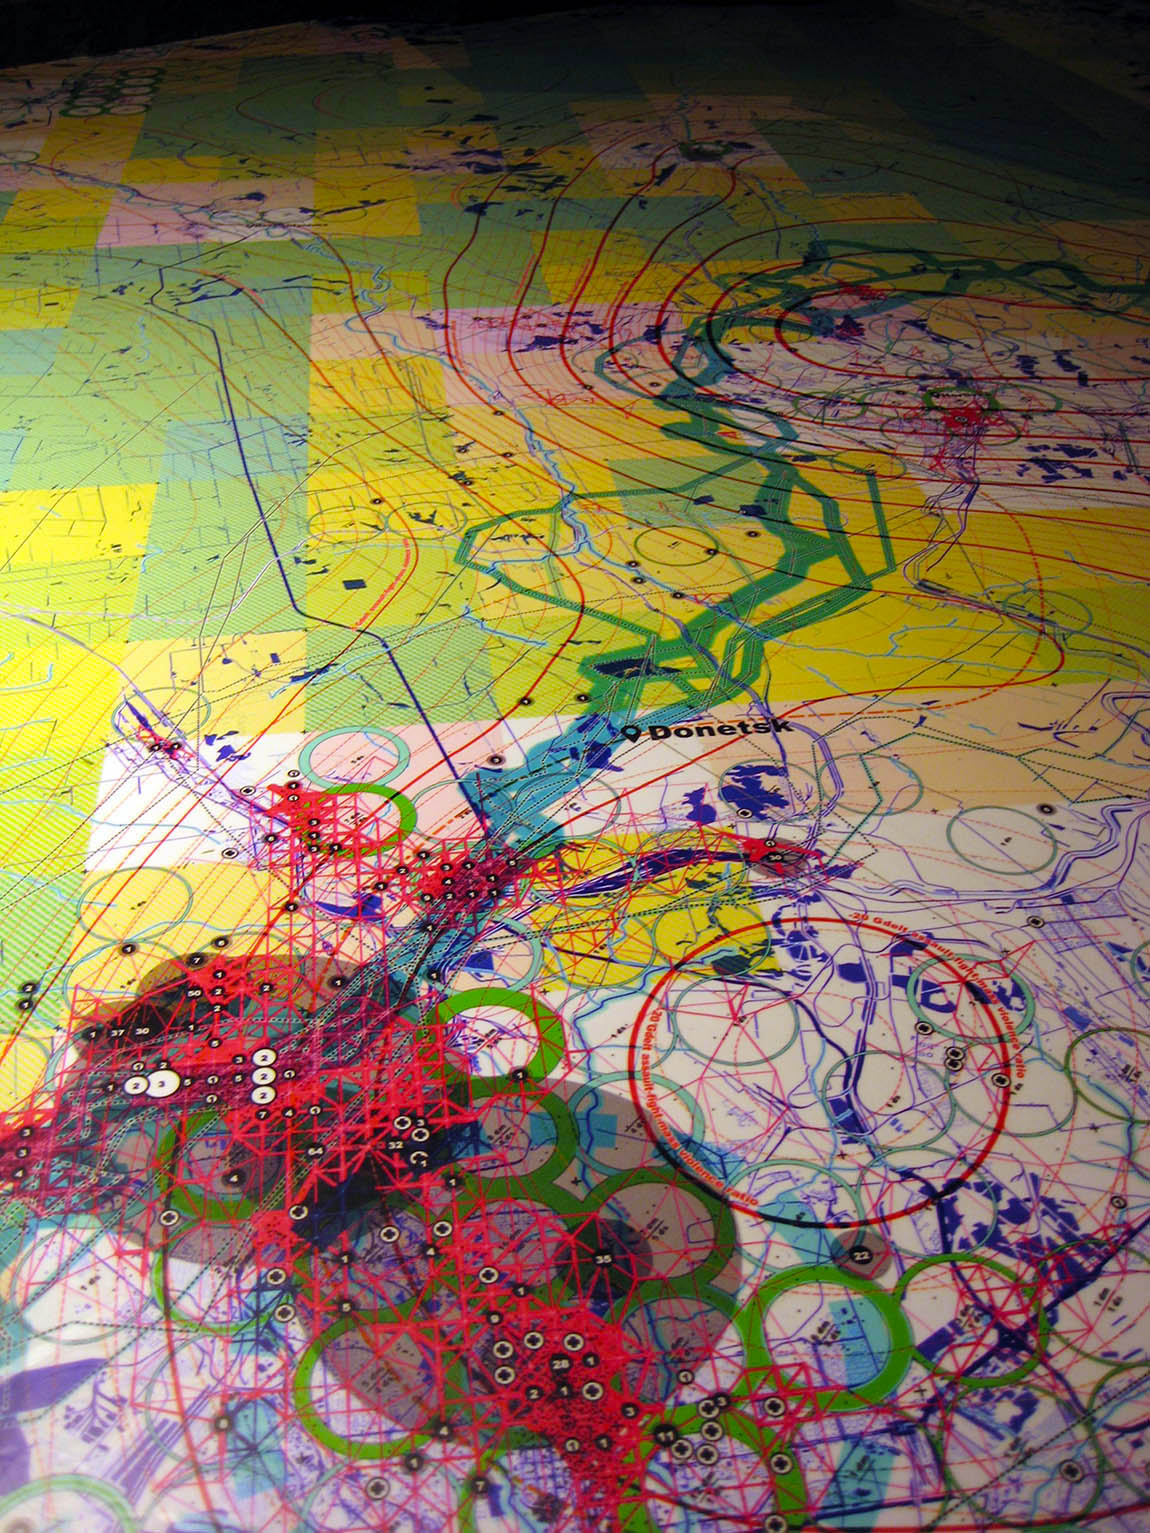
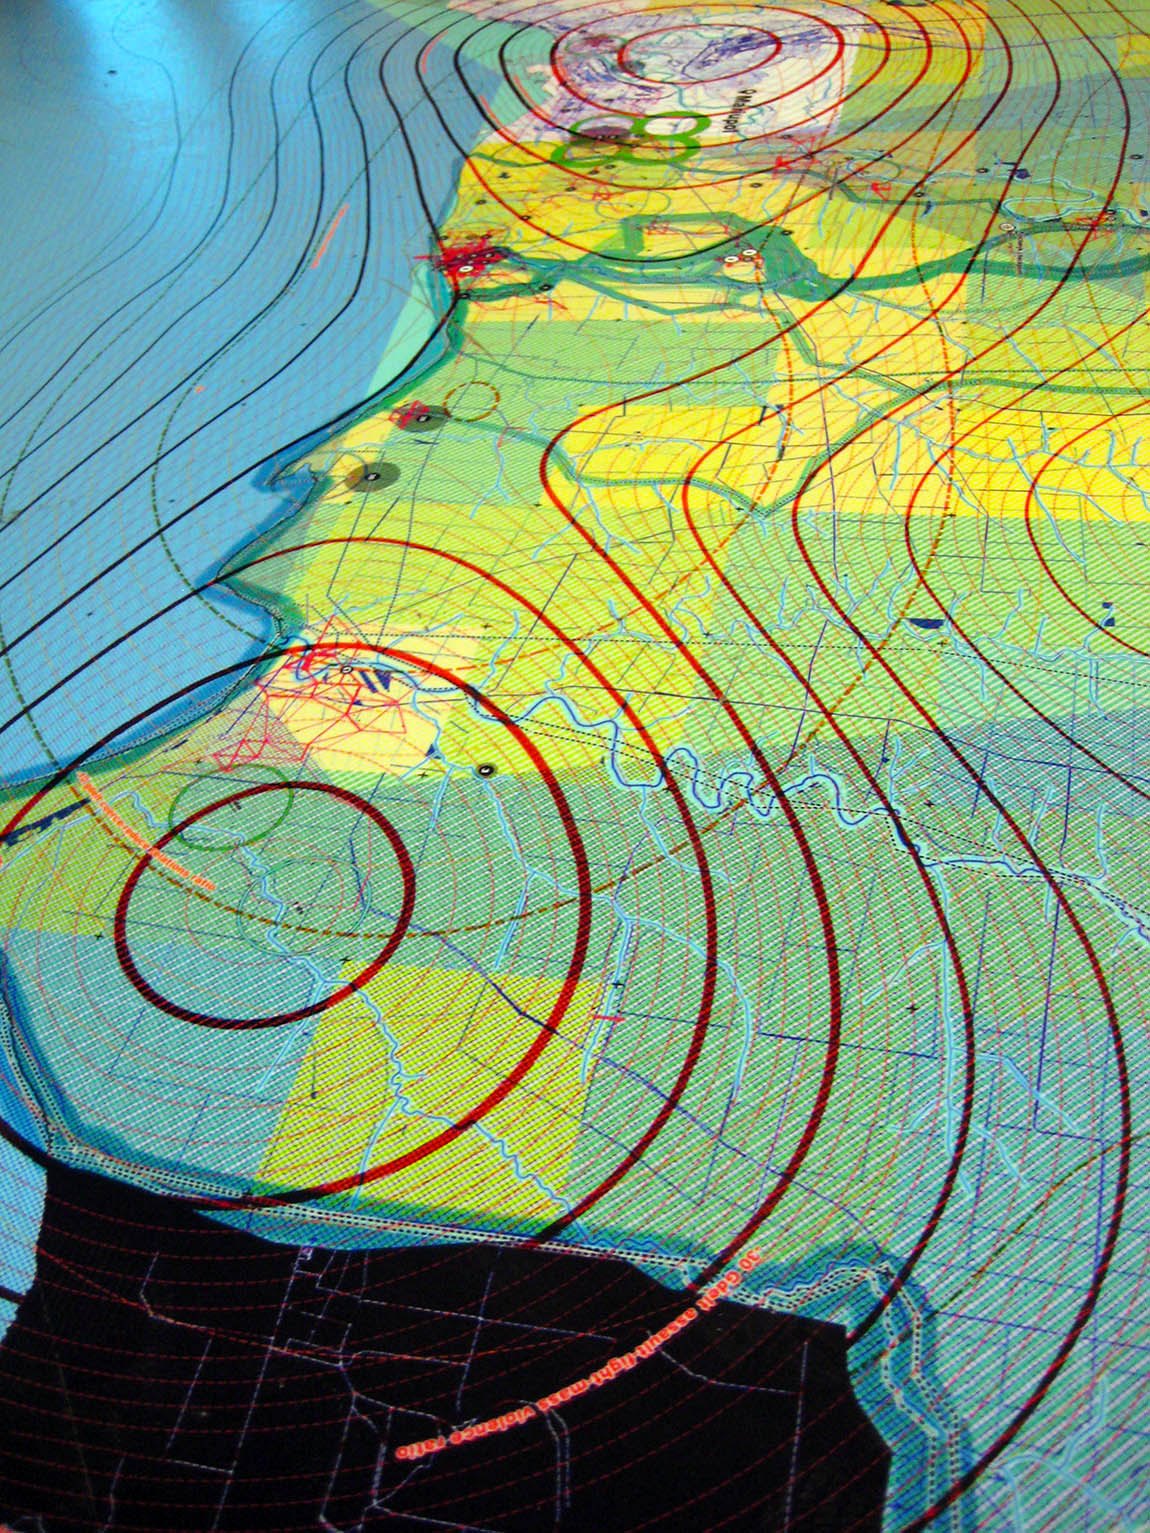
the ukraine war explained throught cartographies made with data

see the map

.
Introduction


The overall number of documented casualties in the Donbass conflict, which started in mid-April 2014, now stands at 30,729, including 9,333 killed and 21,396 injured (UN Security Council meeting, 28th April 2016). Numbers vary widely depending on the source: 2,568 civilians were killed from 6 April 2014 to 15 February 2016 according to UN body OCHA while Donetsk People's Republic reports 3,938 civilian deaths in roughly the same period. The opposing sides interpret information depending on their interests. In addition, data generation is a very slow process that could continue well beyond the conflict itself.

Traditional statistics, giving information on general indicators at a country level, become unable to describe a crisis situation like the ongoing war in the Donbass Region. On the other hand, media around the world act a barometer for the situation. Co-operation and human rights associations also report on the evolution of the conflict, and the Internet community, via social networks or collaborative cartography, can describe the problem at smaller scale. These other data sources, that are normally used to describe phenomena at an urban scale, become essential for accurately illustrating a territory under pressure.


The information has been captured, processed and represented as following:

data sources:
GAR15


The Global exposure datasets generated by the United Nations Office for Disaster Risk Reduction (UNISDR) is based on a top-down approach where statistical information including socio-economic, building type, and capital stock at a national level are transposed onto 5x5 or 1x1 grids using geographic distribution of population and gross domestic product (GDP) data as proxies. In this case, we used it as a territorial description outside urban areas and a mask for main cities. Both low-income (colour gradient) and population (white gradient) parameters have been represented.

Middle lower income referred to rural population
Population in rural areas
data sources:
OSM


OpenStreetMap is a free, editable map of the whole world that is being built by volunteers largely from scratch and released with an open-content license. OpenStreetMaps presents a high quality image of the whole Donbass area. We have illustrated roads, rivers, and buildings in accordance to hierarchy. All elements that could be targeted in military conflicts have been highlighted: bridges, tunnels, industrial areas and medical facilities.

Natural environment
Built environment
data sources:
Redonbass


Redonbass maps the level of destruction of residential and public infrastructure. At the moment there is no publicly available database of damaged public buildings and housing. The tool allows anyone with access to a mobile phone to report and collect the data on the building with its location and photographs of the damage. Interactions have been divided in two layers, destroyed and damaged assets, and aggregated within an area of 2,5 km.

Damaged areas
Destroyed areas
data sources:
Liveumap


Liveuamap is open data-driven media platform that uploads daily maps, messages, pictures and videos from the conflict zone in Ukraine. We have extracted and processed more than 29.500 events in the Donbass Region from April 2014 to April 2016. First, changing boundaries have been depicted depending on the position and date of an event. Traces advance, reverse or remain throughout the conflict. Second, interactions related to attacks have been filtered in order to draw a geometry of areas with more casualties. The number of attacks modulates the width of lines between different zones. Third, the content of each event has been manually interpreted to summarize the number of death and captured people. Data has been plotted by using points with a variable radius relative to the number of casualties. Fourth, events dealing with humanitarian cooperation, such as refugee camps, have been also geolocated. Finally, speeches and protests act as a symbolic layer, mainly surrounding the city of Donetsk.

Casualties (number of dead and captured)
Geometry of attack
Georeferenced events
Speech and protests
Changing boundaries over the conflict
data sources:
GDELT


GDELT project geolocates and analyses daily all news from worldwide media. 1.942.365 georeferenced events have been extracted in Ukraine from November 2013 to April 2016. These events have been analysed according to several parameters including actor, number of articles, number of mentions, level of impact and category.

The final representation illustrates a selection of events according to CAMEO code (Conflict and Mediation Event Observations) portraying advanced stages of conflict such as coercion, reduction of relations, assault, combat and use of unconventional mass violence. The resultant geometry is the superimposition of two topographies where the weight of each point depends on the Goldstein index—a ratio that measures the impact of an event on the stability of a country.

Fight, attack and use of unconventional mass violence
Coerce and reduce relations
data sources:
Flickr


Flickr has grown into one of the premier photo hosting and sharing sites on the internet, boasting an upload rate of more than 7,000 photos per minute. Flickr releases a set of boundaries based on place type; one for each continent, country, region (state), county, locality (city), and neighbourhood. These boundaries symbolise a very subjective idea of territory. For instance, the Flickr limit of a region can match the border between continents or countries. On the contrary, there are gaps, areas with no photography. These no man’s lands have been depicted as ideal geometries above real territory.

Areas without perception
data sources:
OCHA


Checkpoints have been geolocated according to United Nations Office for the Coordination of Humanitarian Affairs (OCHA) reports 2014, 2016.

Checkpoint and humanitarian aid
Open and closed checkpoints
data sources:
Others


Several sources regarding killed, injured and displaced inhabitants in the Donbass regions have been contrasted. Among them: IDMC, HRW, UNHCR, OCHA, MoSP, State Emergency Service, NGO Crimean Diaspora, Donetsk Stat and Population statistics of Eastern Europe.

Number of displaced since 2014
the space
spazzio ridotto

Calle del Ridotto - 1835 San Marco, Venezia

the space
spazzio ridotto
-
photos
-
Credits

data and design:

300.000Km/s

Pablo Martínez Díez

Mar Santamaria Varas

powered by:

Izolyatsia

presented at:

la Biennale di Venezia